> ## Documentation Index
> Fetch the complete documentation index at: https://docs.suga.app/llms.txt
> Use this file to discover all available pages before exploring further.
# Logs
> Structured logging, severity detection, retention, and limitations
How logs are captured, how severity is detected, which logging libraries work out of the box, how long logs are kept, and the known limitations.
For metrics and the wider observability overview, see [Observability](/reference/observability).
## How logging works
No SDK or extra library is required:
* Anything your container writes to **stdout** or **stderr** is captured.
* Each line is parsed, assigned a severity, and appears in the logs explorer within seconds.
* One line in your container is one entry in the explorer. Multi-line output is split into separate entries (see [Limitations](#limitations-and-gotchas)).
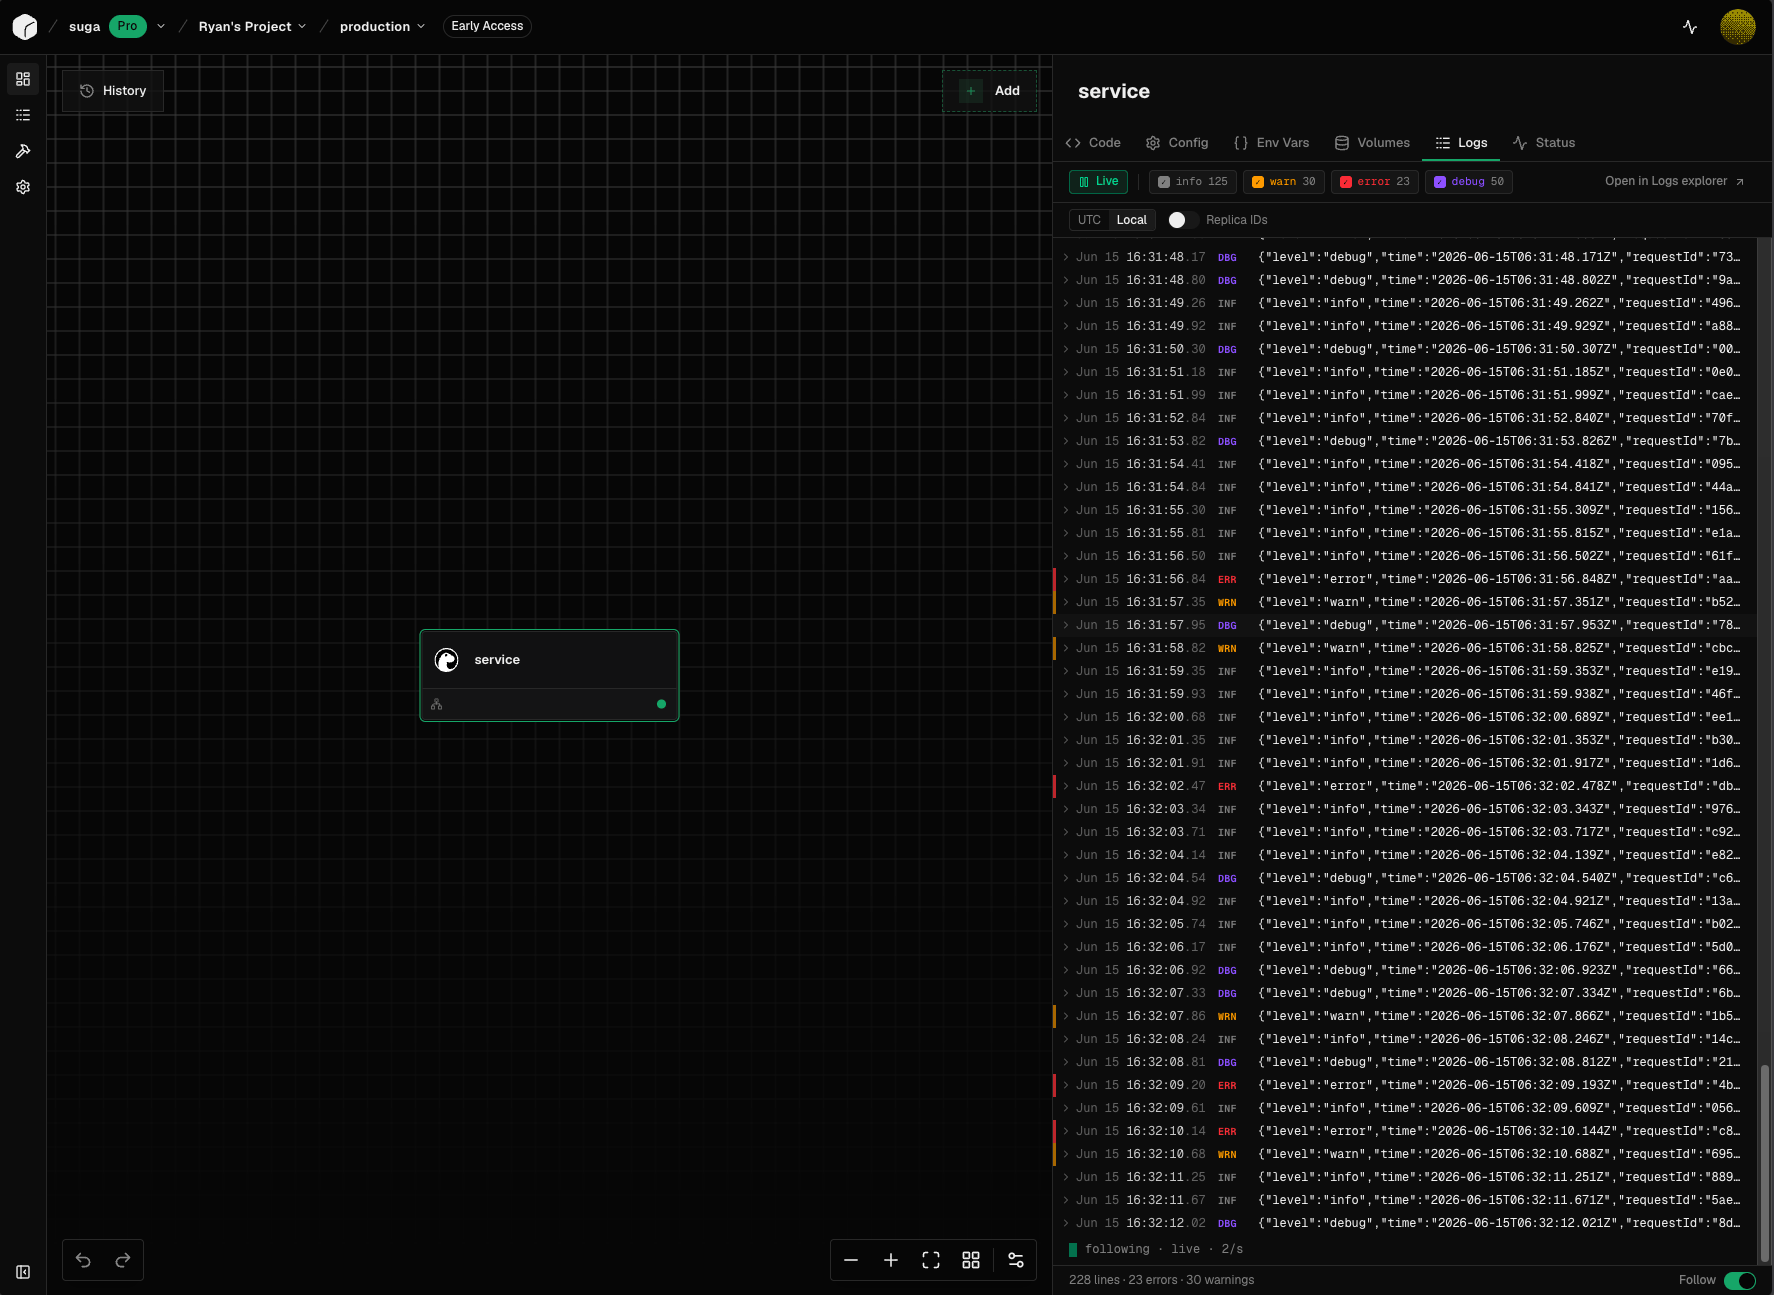
Find your logs in the **Logs** tab of the service properties panel. Select a service on the canvas to open it.
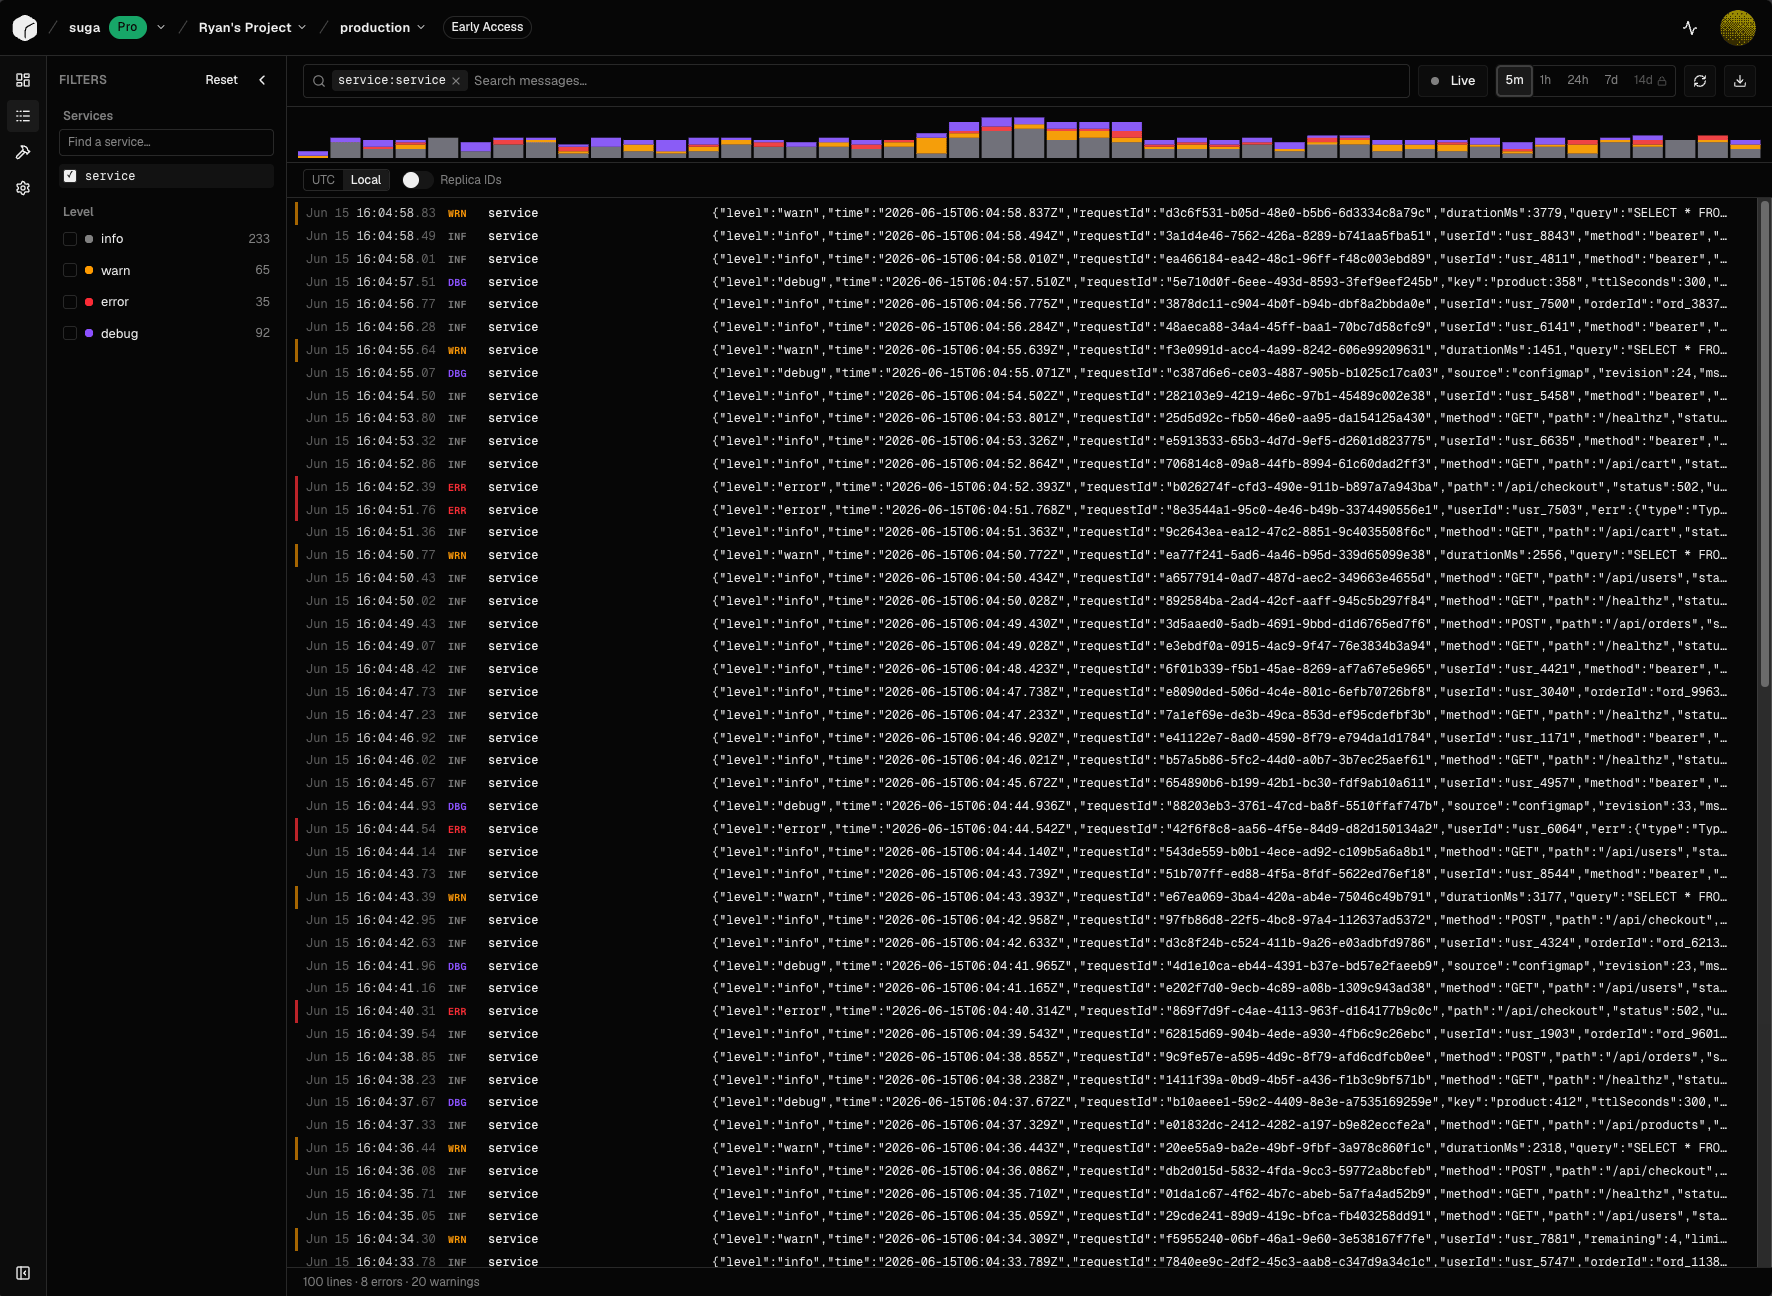
 Select **Open in Logs explorer** for the full view: a histogram of volume by level over time, level facets for filtering, a per-replica toggle, a time-range picker, and a detail panel for individual entries.
 ## Structured logging
Plain text gives you logs, but structured logging makes them queryable and correctly leveled.
Each line is parsed as JSON. When parsing succeeds, every key becomes a queryable field on the entry, visible in the detail panel. When it fails, the line is kept as a plain-text body.
### How severity is detected
Severity is read from the parsed JSON in priority order. The first matching field wins:
| Priority | Field | Type | Common producers |
| -------- | ----------------- | --------------------- | ----------------------------------------------------------------------------------------------------------------------------------------------------------------------------------------- |
| 1 | `severity_number` | OTLP integer, 1 to 24 | OpenTelemetry Logs SDK |
| 2 | `levelname` | string | Python `python-json-logger` |
| 3 | `level` | numeric or string | pino, bunyan, roarr (numeric 10/20/30/40/50/60); winston, zap, zerolog, slog, logrus, structlog, logback, log4j, Microsoft.Extensions.Logging, Serilog (string `"info"`, `"ERROR"`, etc.) |
| 4 | `severity` | string | GCP Cloud Logging convention |
**Emit only one severity field per line.** If more than one is present, the
result is undefined. Pick one logger and let it own the field.
### Worked examples
Each emits a JSON line that gets parsed and leveled correctly.
```ts Node (pino) theme={null}
import pino from "pino";
const logger = pino();
logger.warn({ userId }, "user not found");
// emits: {"level":40, ..., "msg":"user not found"}
// detected as WARN via priority 3 (numeric level)
```
```python Python (python-json-logger) theme={null}
import logging
from pythonjsonlogger.json import JsonFormatter
handler = logging.StreamHandler()
handler.setFormatter(JsonFormatter())
log = logging.getLogger(__name__)
log.addHandler(handler)
log.setLevel(logging.INFO)
log.warning("user not found", extra={"user_id": user_id})
# emits: {"levelname": "WARNING", ..., "message": "user not found"}
# detected as WARN via priority 2 (levelname)
```
```go Go (slog) theme={null}
logger := slog.New(slog.NewJSONHandler(os.Stdout, nil))
logger.Warn("user not found", "user_id", userID)
// emits: {"time":"...","level":"WARN", ..., "msg":"user not found"}
// detected as WARN via priority 3 (string level)
```
## Library compatibility
If you use one of these libraries with JSON output enabled, severity is detected out of the box:
| Library | Language | Field set |
| ---------------------------- | -------- | --------------------------- |
| OpenTelemetry Logs SDK | any | `severity_number` (1 to 24) |
| python-json-logger | Python | `levelname` |
| pino | Node.js | `level` (10/20/30/40/50/60) |
| bunyan | Node.js | `level` (10/20/30/40/50/60) |
| roarr | Node.js | `level` (10/20/30/40/50/60) |
| winston | Node.js | `level` (string) |
| zap | Go | `level` (string) |
| zerolog | Go | `level` (string) |
| slog | Go | `level` (string) |
| logrus | Go | `level` (string) |
| structlog | Python | `level` (string) |
| logback | Java | `level` (string) |
| log4j | Java | `level` (string) |
| Microsoft.Extensions.Logging | .NET | `level` (string) |
| Serilog | .NET | `level` (string) |
| GCP Cloud Logging | any | `severity` (string) |
For any library not listed, emit JSON with a top-level `level` (string or numeric) or `severity_number` (1 to 24) and it will be detected.
## Retention
How long logs stay in the explorer depends on your plan:
| Plan | Retention |
| ---------- | ---------------------- |
| Free | 1 day |
| Pro | 7 days |
| Enterprise | Custom (beyond 7 days) |
Custom retention beyond 7 days is available on Enterprise. See the observability row in the [plan comparison](https://www.suga.app/pricing#observability) for details.
Logs older than your retention window are removed from the explorer entirely. There is no archive to recover them from.
## Limitations and gotchas
**`console.warn` and `console.error` are not auto-detected.**
Plain text only becomes WARN or ERROR when the body contains a word-bounded match for one of: `warn`, `warning`, `error`, `err`, `fatal`, `panic`, `exception`, `critical`, `crit`, `debug`. So `console.warn("user not found")` shows up as **info**. The word boundaries keep phrases like "no errors" from being misclassified. Use a structured logger for reliable levels.
**A Datadog-style `status` field is ignored.**
Many apps log `{"status": 500}` for an HTTP status or `{"status": "error"}` for business state, so `status` is left alone. Use `level`, `severity`, `levelname`, or `severity_number` instead.
**Multi-line output is split into one entry per line.**
A bare `console.error(err)` in Node prints `Error: ...` followed by each stack frame on its own line, and every line becomes a separate entry. Log the error through a structured logger so the stack stays inside one JSON line as a field (for example `logger.error({ err }, "request failed")` with pino).
**Emit one severity field per line.**
When more than one is present, the result is undefined.
## Structured logging
Plain text gives you logs, but structured logging makes them queryable and correctly leveled.
Each line is parsed as JSON. When parsing succeeds, every key becomes a queryable field on the entry, visible in the detail panel. When it fails, the line is kept as a plain-text body.
### How severity is detected
Severity is read from the parsed JSON in priority order. The first matching field wins:
| Priority | Field | Type | Common producers |
| -------- | ----------------- | --------------------- | ----------------------------------------------------------------------------------------------------------------------------------------------------------------------------------------- |
| 1 | `severity_number` | OTLP integer, 1 to 24 | OpenTelemetry Logs SDK |
| 2 | `levelname` | string | Python `python-json-logger` |
| 3 | `level` | numeric or string | pino, bunyan, roarr (numeric 10/20/30/40/50/60); winston, zap, zerolog, slog, logrus, structlog, logback, log4j, Microsoft.Extensions.Logging, Serilog (string `"info"`, `"ERROR"`, etc.) |
| 4 | `severity` | string | GCP Cloud Logging convention |
**Emit only one severity field per line.** If more than one is present, the
result is undefined. Pick one logger and let it own the field.
### Worked examples
Each emits a JSON line that gets parsed and leveled correctly.
```ts Node (pino) theme={null}
import pino from "pino";
const logger = pino();
logger.warn({ userId }, "user not found");
// emits: {"level":40, ..., "msg":"user not found"}
// detected as WARN via priority 3 (numeric level)
```
```python Python (python-json-logger) theme={null}
import logging
from pythonjsonlogger.json import JsonFormatter
handler = logging.StreamHandler()
handler.setFormatter(JsonFormatter())
log = logging.getLogger(__name__)
log.addHandler(handler)
log.setLevel(logging.INFO)
log.warning("user not found", extra={"user_id": user_id})
# emits: {"levelname": "WARNING", ..., "message": "user not found"}
# detected as WARN via priority 2 (levelname)
```
```go Go (slog) theme={null}
logger := slog.New(slog.NewJSONHandler(os.Stdout, nil))
logger.Warn("user not found", "user_id", userID)
// emits: {"time":"...","level":"WARN", ..., "msg":"user not found"}
// detected as WARN via priority 3 (string level)
```
## Library compatibility
If you use one of these libraries with JSON output enabled, severity is detected out of the box:
| Library | Language | Field set |
| ---------------------------- | -------- | --------------------------- |
| OpenTelemetry Logs SDK | any | `severity_number` (1 to 24) |
| python-json-logger | Python | `levelname` |
| pino | Node.js | `level` (10/20/30/40/50/60) |
| bunyan | Node.js | `level` (10/20/30/40/50/60) |
| roarr | Node.js | `level` (10/20/30/40/50/60) |
| winston | Node.js | `level` (string) |
| zap | Go | `level` (string) |
| zerolog | Go | `level` (string) |
| slog | Go | `level` (string) |
| logrus | Go | `level` (string) |
| structlog | Python | `level` (string) |
| logback | Java | `level` (string) |
| log4j | Java | `level` (string) |
| Microsoft.Extensions.Logging | .NET | `level` (string) |
| Serilog | .NET | `level` (string) |
| GCP Cloud Logging | any | `severity` (string) |
For any library not listed, emit JSON with a top-level `level` (string or numeric) or `severity_number` (1 to 24) and it will be detected.
## Retention
How long logs stay in the explorer depends on your plan:
| Plan | Retention |
| ---------- | ---------------------- |
| Free | 1 day |
| Pro | 7 days |
| Enterprise | Custom (beyond 7 days) |
Custom retention beyond 7 days is available on Enterprise. See the observability row in the [plan comparison](https://www.suga.app/pricing#observability) for details.
Logs older than your retention window are removed from the explorer entirely. There is no archive to recover them from.
## Limitations and gotchas
**`console.warn` and `console.error` are not auto-detected.**
Plain text only becomes WARN or ERROR when the body contains a word-bounded match for one of: `warn`, `warning`, `error`, `err`, `fatal`, `panic`, `exception`, `critical`, `crit`, `debug`. So `console.warn("user not found")` shows up as **info**. The word boundaries keep phrases like "no errors" from being misclassified. Use a structured logger for reliable levels.
**A Datadog-style `status` field is ignored.**
Many apps log `{"status": 500}` for an HTTP status or `{"status": "error"}` for business state, so `status` is left alone. Use `level`, `severity`, `levelname`, or `severity_number` instead.
**Multi-line output is split into one entry per line.**
A bare `console.error(err)` in Node prints `Error: ...` followed by each stack frame on its own line, and every line becomes a separate entry. Log the error through a structured logger so the stack stays inside one JSON line as a field (for example `logger.error({ err }, "request failed")` with pino).
**Emit one severity field per line.**
When more than one is present, the result is undefined.